← apps
cpuTopBars app icon: four bars of colored segments on a white grid
CPUTOPBARS · Mac menu-bar app

Your Mac's load,
at a glance.

A small, live graph in your menu bar: CPU and every core, GPU, Neural Engine, memory, disk, battery and Wi-Fi. Click it for your top processes and a panel of readings. Everything is read on your Mac, and nothing is sent anywhere. If you keep the macOS Battery and Wi-Fi menu-bar items only to check their status, its battery and Wi-Fi bars can stand in for them (without their controls), so you can hide those and free up space in your menu bar.

Free · open source (MIT) Open beta · TestFlight Mac App Store release to follow

Free beta · open the link on your Mac · installs through Apple’s TestFlight app

Real captures on a dark menu bar. Each bar has its letter under it: B battery, W Wi-Fi, D disk, M memory, N Neural Engine, G GPU, C CPU, E and P the efficiency and performance cores.

The cpuTopBars graph in the macOS menu bar, beside the clock: a red battery bar, full, with its bolt (at 100%, on battery), Wi-Fi, disk and memory bars, then Neural Engine, GPU and CPU bars, then efficiency-core and performance-core bars, each lettered underneath
Hiding in the menu bar
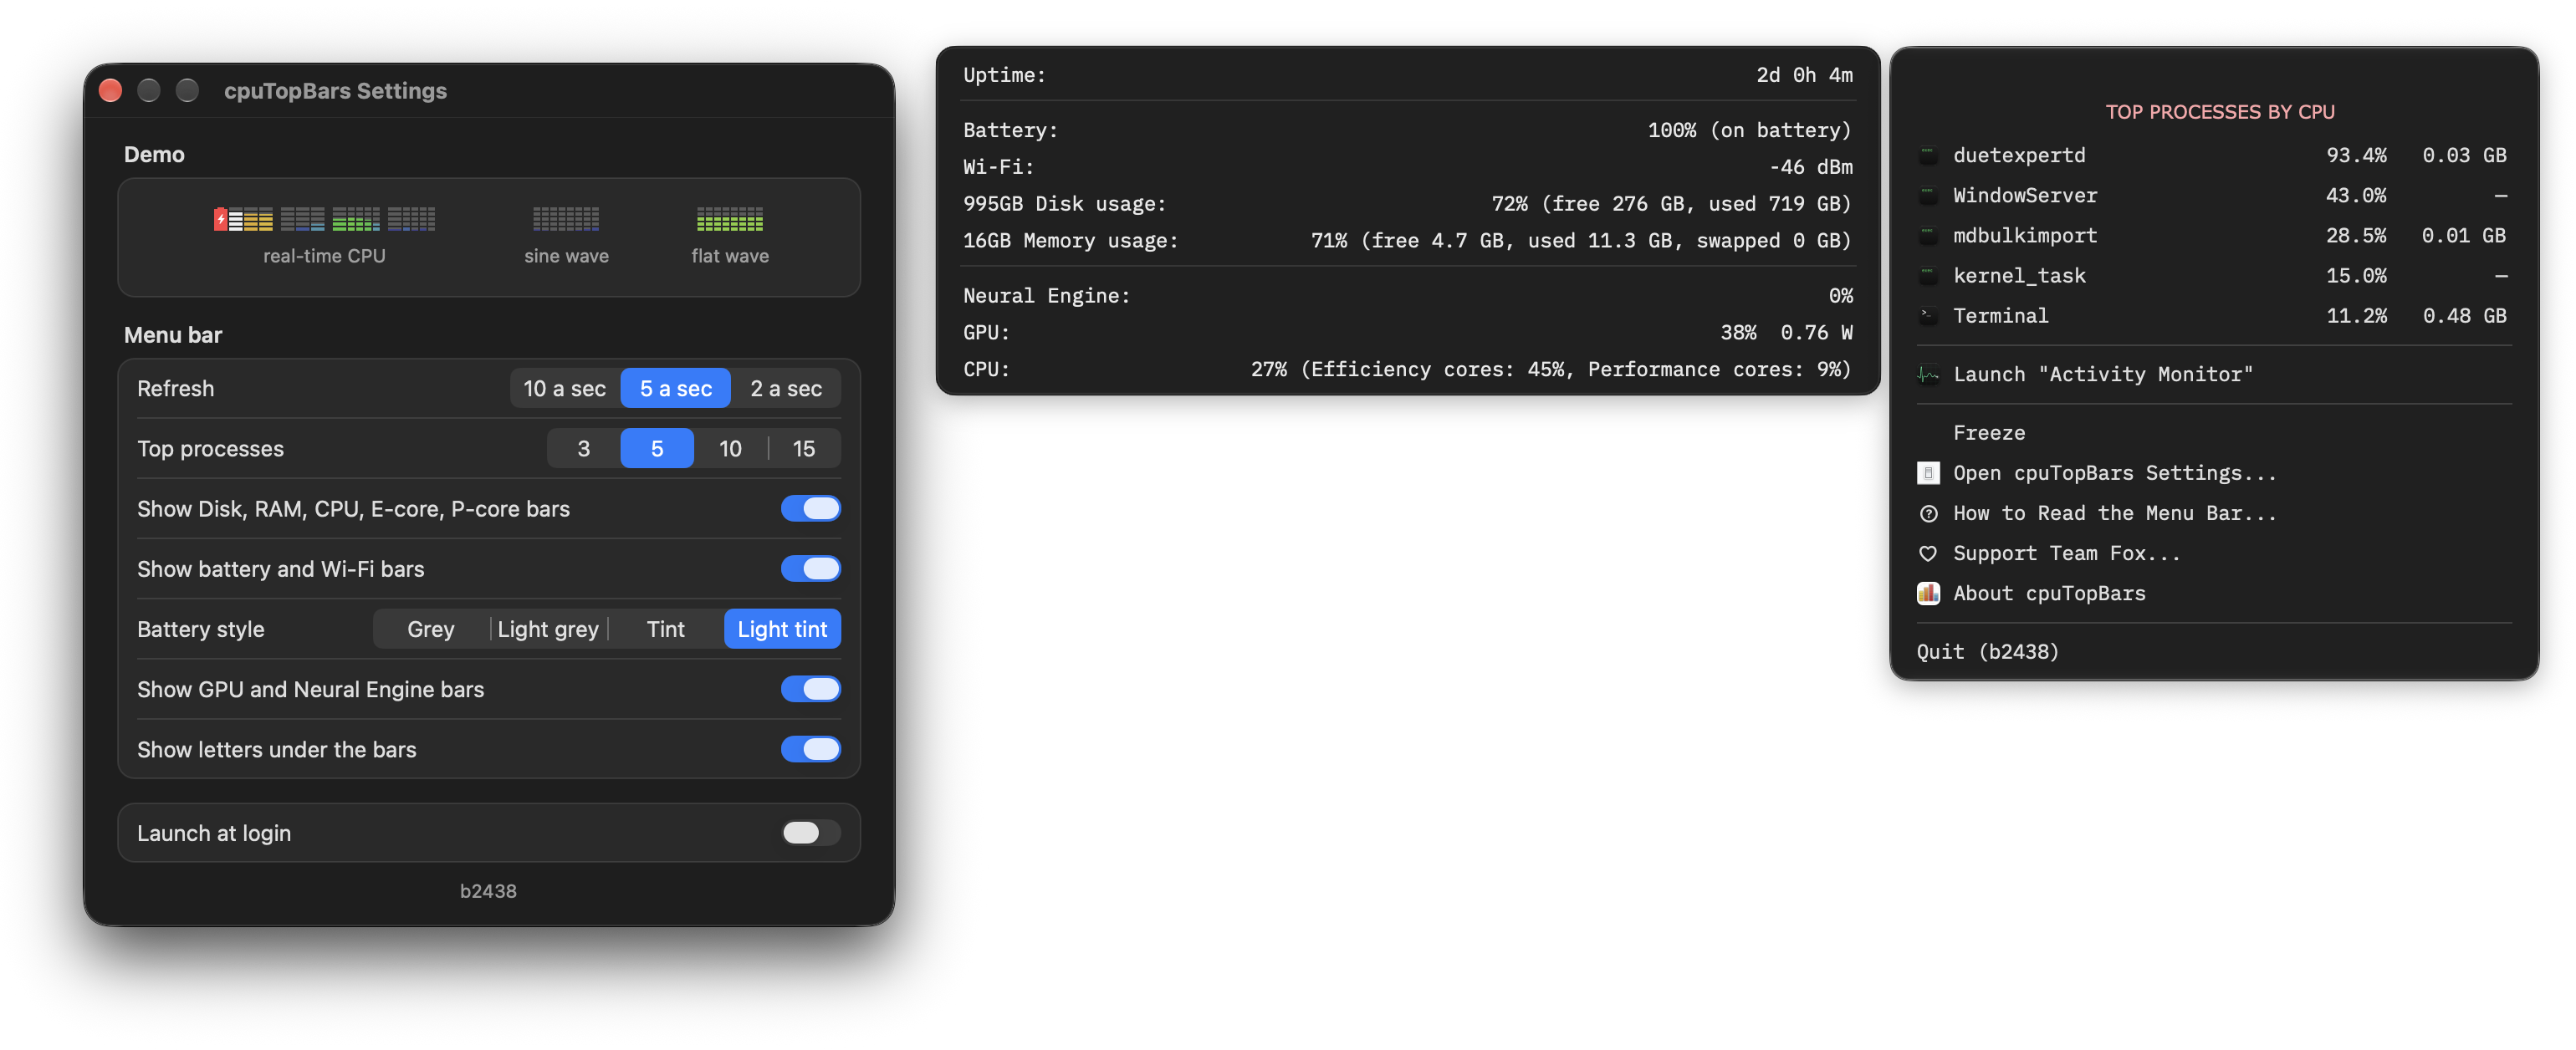
Three panels side by side: cpuTopBars Settings with a live demo of the graph, refresh rate, number of processes and switches for each group of bars; a readings panel with uptime, battery, Wi-Fi, disk, memory, Neural Engine, GPU and CPU; and the menu listing the top processes by CPU with, for your own processes, their memory, then Activity Monitor, Freeze, Settings, How to Read the Menu Bar, Support Team Fox and About
Settings, the readings panel and the process menu, as built from source

Rest the pointer on a bar for a second and its reading appears below the menu bar.
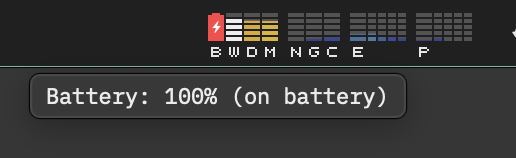
Battery label: charge and whether it is charging
Battery
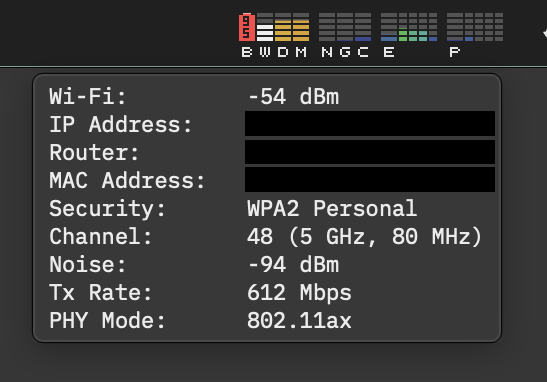
Wi-Fi label: signal, then IP address, router and MAC address (blacked out), security, channel, noise, transmit rate and PHY mode
Wi-Fi
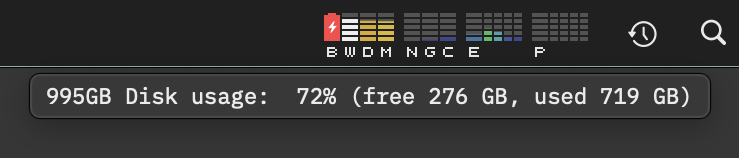
Disk label: startup volume use with free and used space
Disk
Memory label: memory in use with free, used and swapped memory
Memory
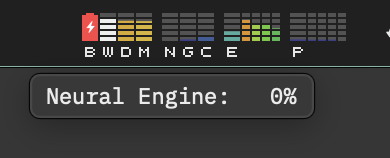
Neural Engine label: its busy share, as built from source
Neural Engine, built from source
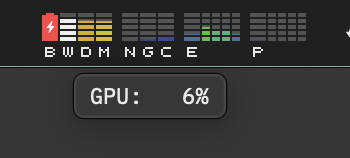
GPU label: the GPU's use
GPU
CPU label: overall use with efficiency and performance cores' use
CPU
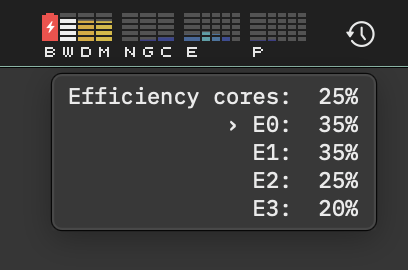
Efficiency cores label: each core's load
Efficiency cores
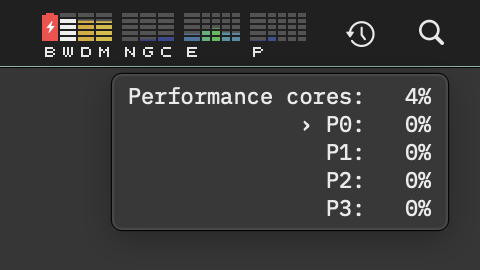
Performance cores label: each core's load
Performance cores

●A live graph, not a number

Bars for the battery, Wi-Fi, disk, memory, Neural Engine, GPU and CPU, then one for each core. Choose 2, 5 or 10 updates a second, and switch any group of bars off in Settings.

●Top processes, one click away

Your busiest processes ranked by CPU, each with its share and, for your own processes, its memory. Freeze the list to read it while the graph keeps running.

●A panel of readings

Open the menu and a panel beside it shows uptime, battery, Wi-Fi signal, disk, memory with swap, GPU, Neural Engine and CPU by core type.

●A process inspector

Click a process to see its man page, where it has one, and its arguments and environment. Activity Monitor is one click away too.

●Room in your menu bar

If you keep the Battery and Wi-Fi items only to check their status, these bars can take their place. They have none of those items' controls, and they do not show the network's name.

●Explains itself

"How to Read the Menu Bar" opens a window that explains every bar and color with drawn examples. Settings opens with a live demo of the graph.

The same code, built two ways. The App Store asks every app to run in its sandbox, and the sandbox limits what an app may see of other processes.

Build it from source

Free · MIT · available now
  • Ranks every user's processes, system daemons and WindowServer included.
  • The inspector adds lsof, nm and sample tabs, and a Kill button for your own processes.
  • Shows the Neural Engine's busy share and the GPU's power in watts, where they can be read.
  • Runs outside the App Sandbox.
  • To install: clone the repository, open cpuTopBars.xcodeproj in Xcode and choose Product > Run. The graph appears in your menu bar. The README has the details.

From the Mac App Store

Free · open beta on TestFlight now
  • Try it now: get Apple’s free TestFlight app from the Mac App Store, then open the beta’s TestFlight link on your Mac and install it from TestFlight.
  • Ranks your own processes and counts the others in one row.
  • The inspector shows the man page, arguments and environment.
  • Shows the Neural Engine as on or off, and the GPU's use.
  • Runs in the App Sandbox. TestFlight installs and updates the beta; the App Store will update the released app.

Both need macOS 27 or later.

devTopBars app icon

Want more? devTopBars

devTopBars is the paid app built on cpuTopBars. It adds usage bars for an AI coding plan's limits and live sessions, LAN, WAN and VPN address rows, and a way to keep your Mac awake while a chosen process runs. See devTopBars →

Read on your Mac, kept on your Mac

cpuTopBars makes no network requests. Every reading comes from your Mac itself; there are no accounts, no analytics and no third-party SDKs. Its links, such as "Support Team Fox", open a page in your browser only when you choose them.

The full source is on GitHub, so you can check every line. It is the same local-first stance behind everything halfmarble builds; see the Glass Box.

5% of software net profits pledged:
2.5% to Team Fox, the grassroots fundraising program of The Michael J. Fox Foundation
2.5% to Public Health Collaboration (PHC)
halfmarble is an independent Team Fox third-party fundraiser.